Single spectra
Process individual measurements and compare spectral signals with their analysis results.
A research platform for spectral data
Processing, visualization, and collaboration for single spectra, spectral time-series, and hyperspectral datasets.
Process individual measurements and compare spectral signals with their analysis results.
Explore sequences of spectra and follow how spectral signals change over time.
Connect spatial patterns with spectral signals through linked images and line charts.
Text (TXT/ASC), CSV/TSV, JSON, SPC, TIFF/OME-TIFF, Olympus OIR, ENVI, NetCDF, Igor, and OME-Zarr folders.
Processing workflows
Connect processing steps into workflows that run in the cloud. Define the results to save and the visualizations to explore, then save and share workflows for future analyses.
Machine-readable documentation supports workflow design with large language models.
Workflow documentationVisualization and exploration
Select a pixel or region to inspect its spectra. Compare measurements and results, choose visualizations, and arrange the viewer to suit your analysis.
Explore the example project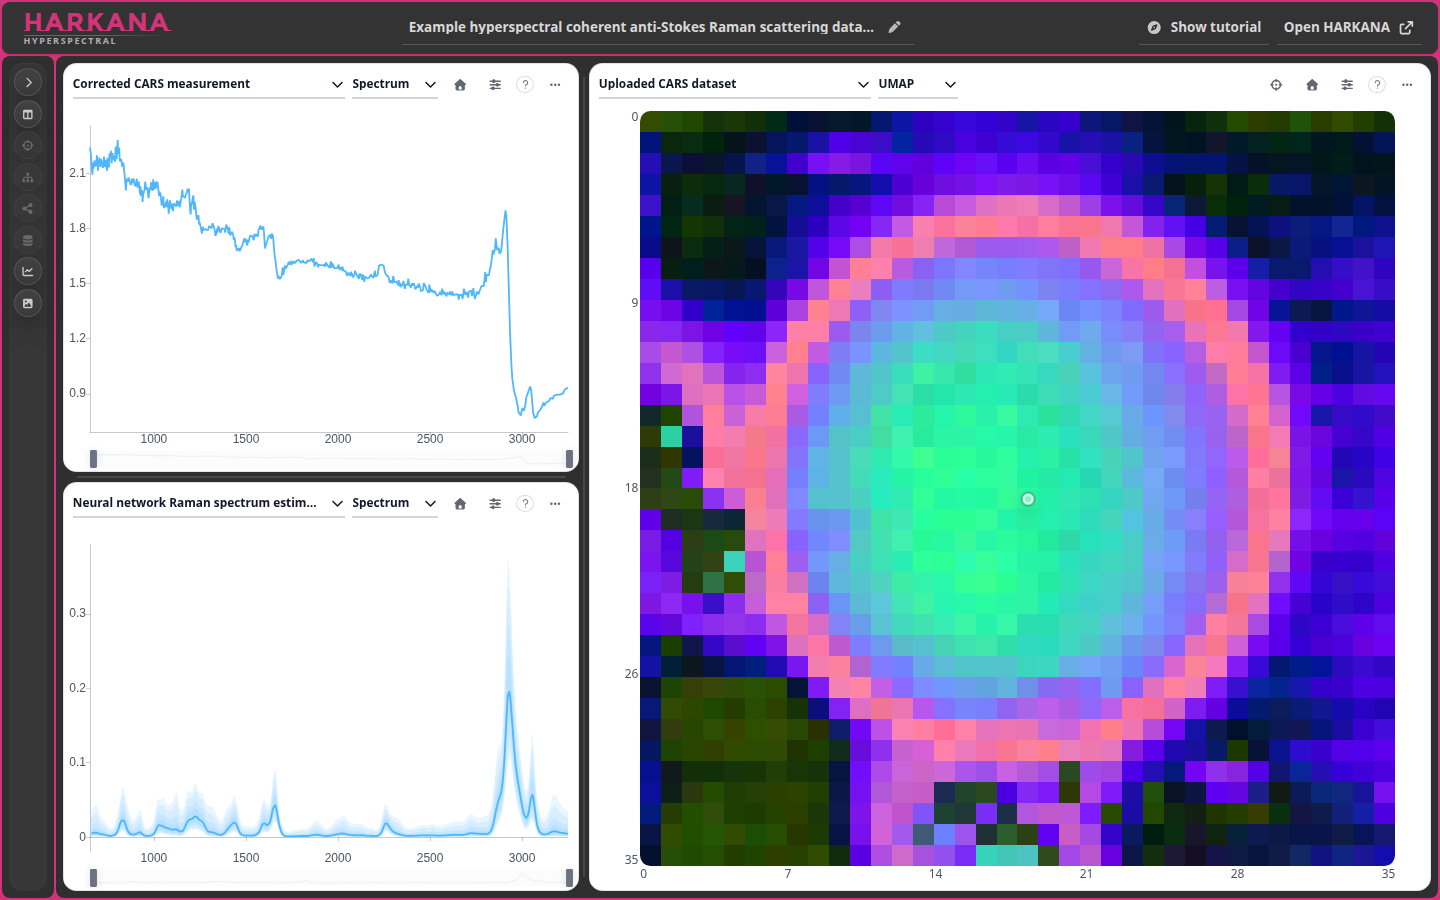
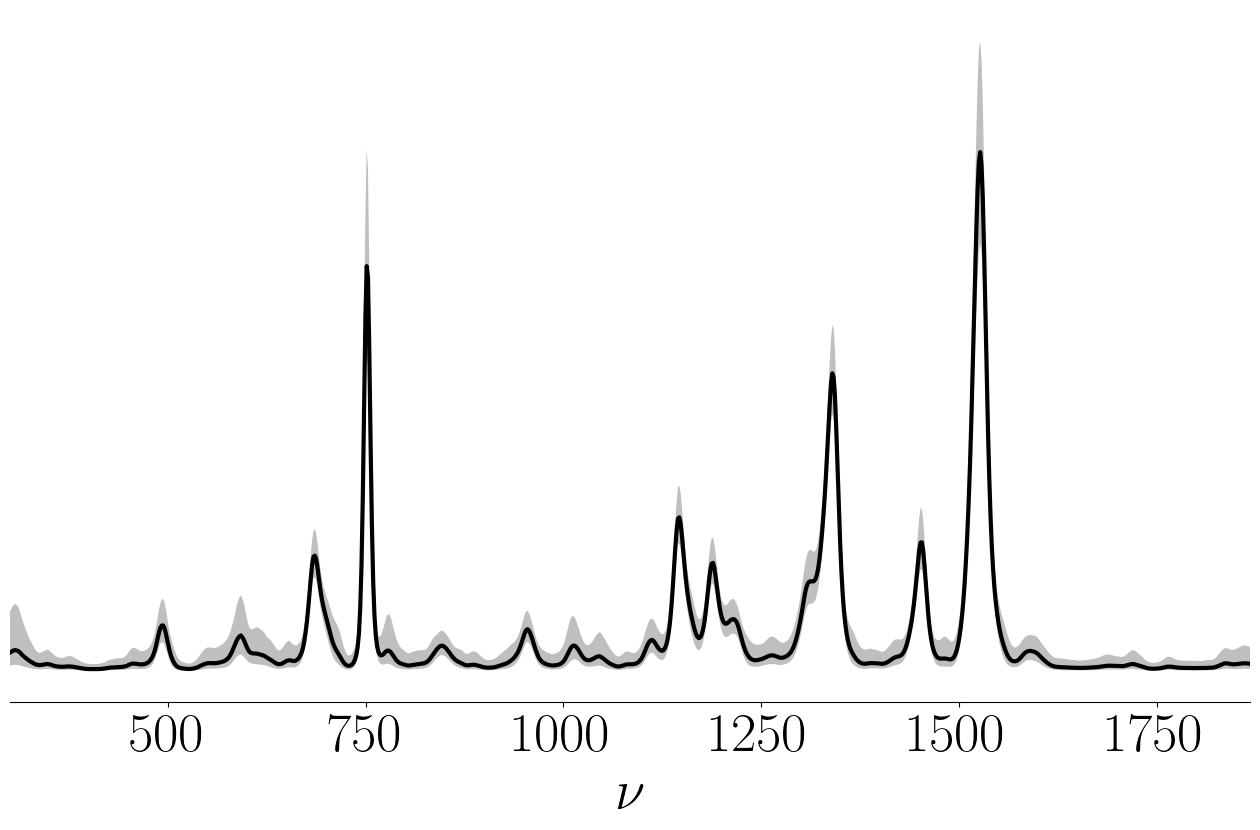
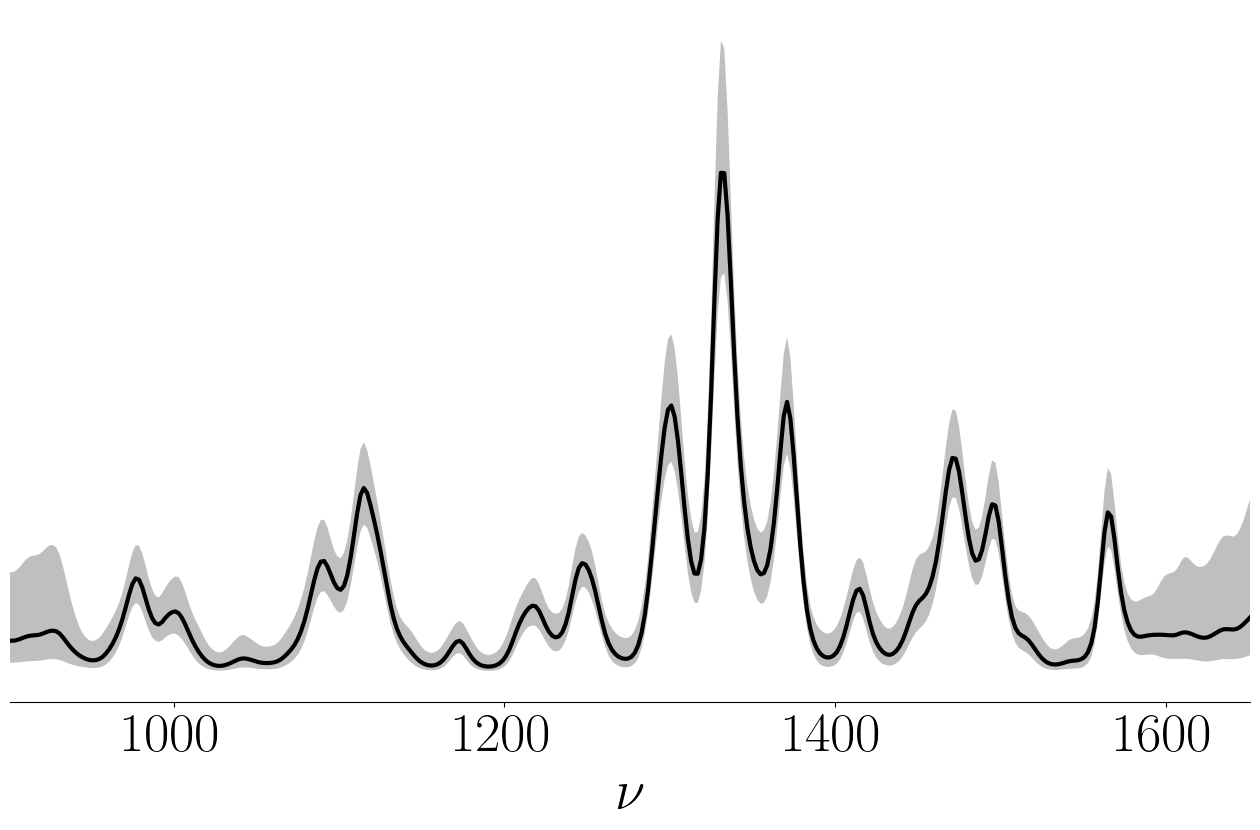
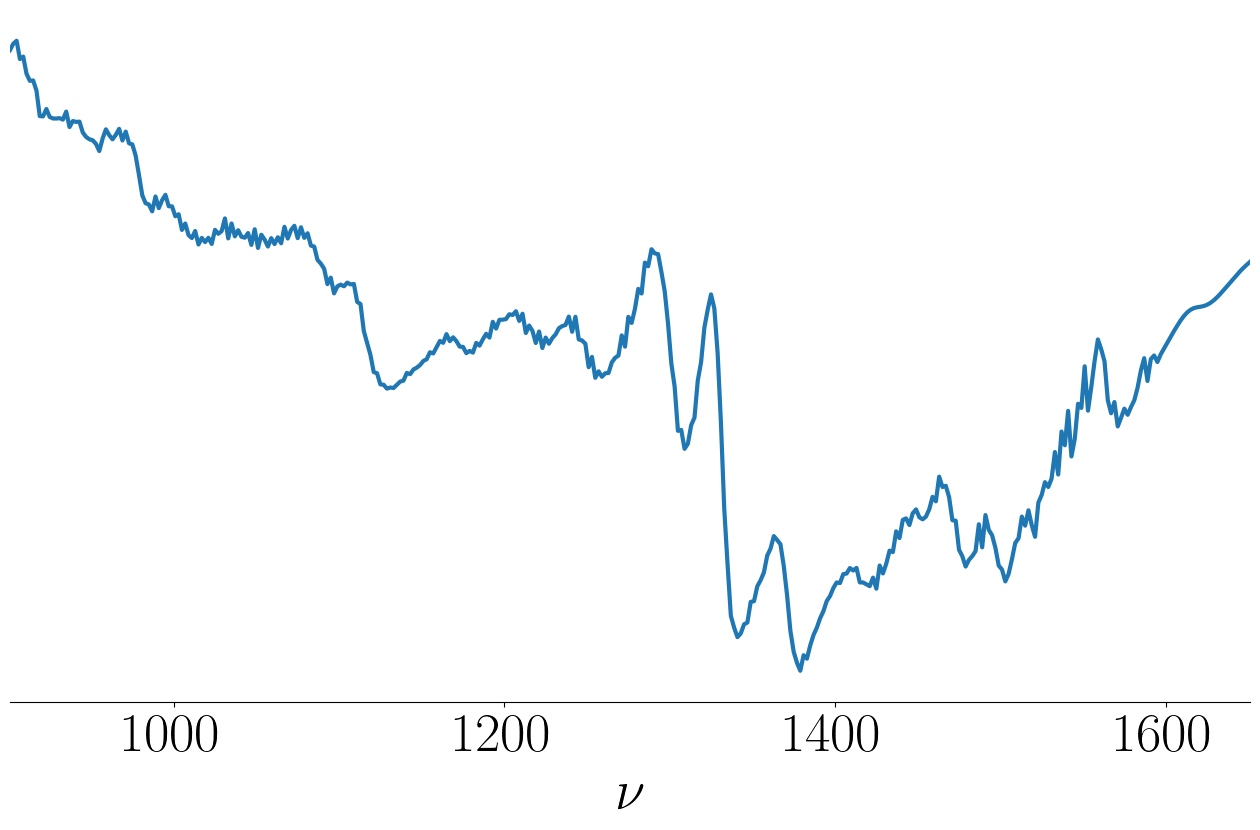
Spectral processing across different measurements: Raman baseline correction and Raman spectrum estimation from CARS.
A measured Raman spectrum and its baseline-corrected result.

A measured CARS spectrum and its estimated Raman spectrum.
Research and collaboration
Keep measurements, metadata, and analysis results together in your projects.
Share datasets, results, and processing workflows with collaborators.
Publish to Zenodo for persistent storage and a digital object identifier (DOI).